Legend's Buy Day — full receipts
📦 Full reproduction package
02 is a standalone pandas backtest for both legs that runs on any 1-minute ES CSV; 03 compares your trades to the frozen ledger date by date. reference/ has every trade since 2008, the 616-cell sweep, the stop/target sweep, the deflated Sharpe and PBO code with output, and the sweep and quant code with output. The 1-minute bars are licensed and not included; on my file the script reproduces this page to the point.
Session day. A session runs from 18:00 ET the prior evening to 17:00 ET. Daily bars are full-session bars, so the close is the 16:59 ET print.
Signal. The three sessions before today each closed below the session before it, and the session before those did not. In Taylor's count today is the session after day 3 of a fresh decline. "Exactly three" is the cell the in-sample sweep picked; "three or more" and "exactly four" are in the neighborhood table and behave the same way with more noise.
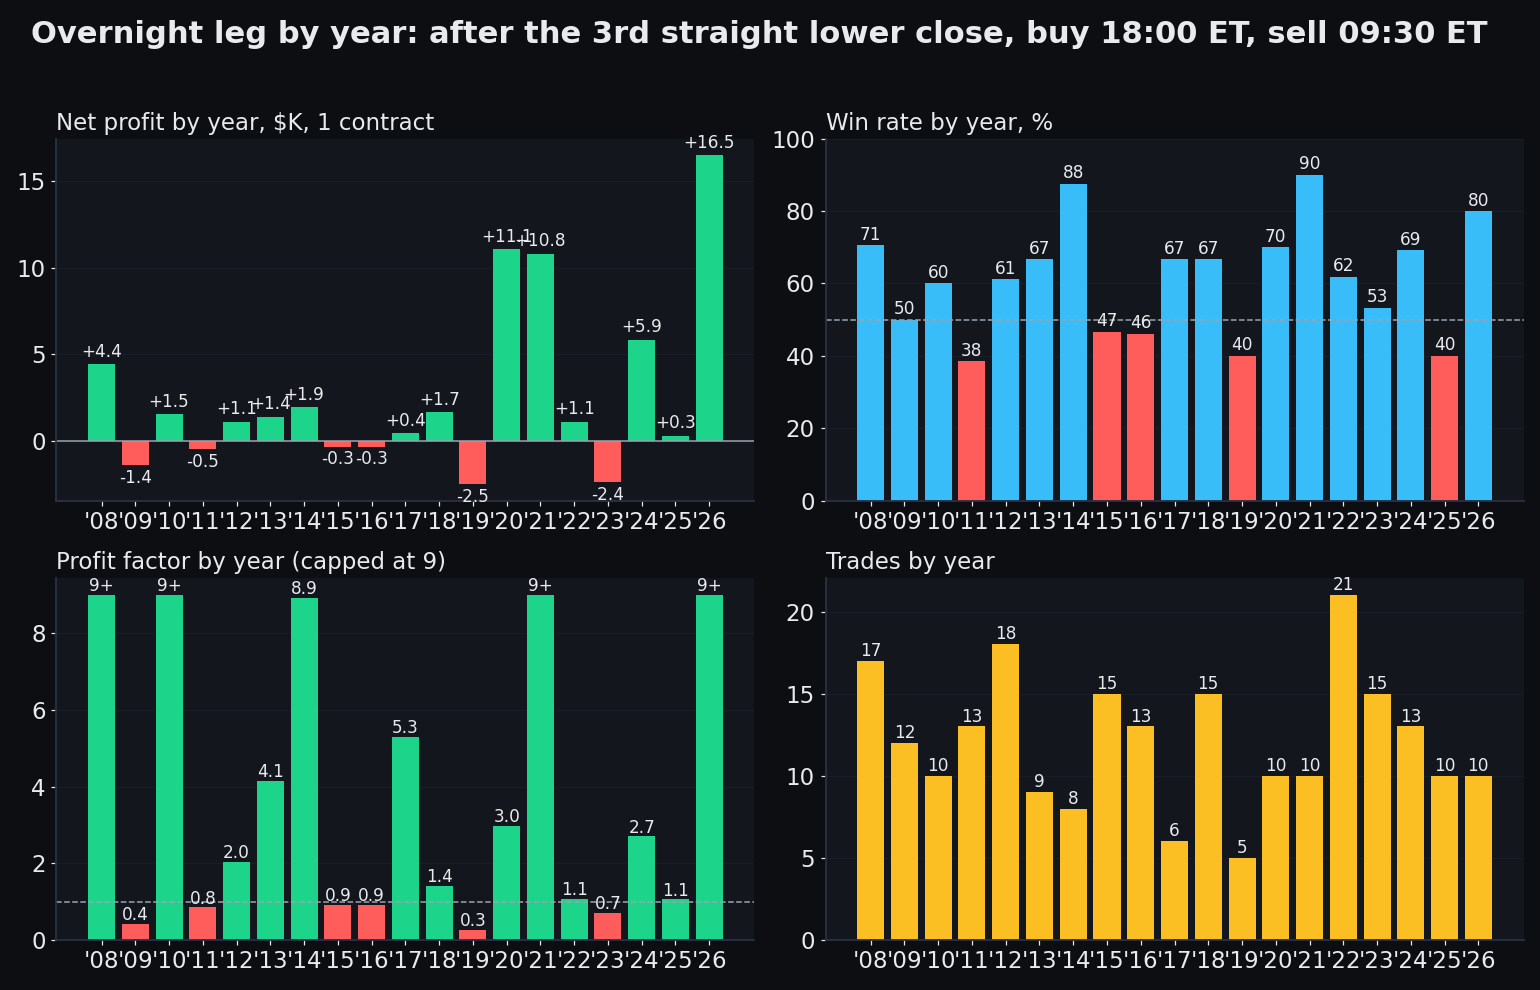
Trade. Buy the open of the first 1-minute bar of the session (18:00 ET). Sell the open of the 09:30 ET bar. No stop, no target. One contract. Nothing after the entry is used to decide anything.
Cost. 0.5 ES points per round trip ($25): two market orders into the 18:00 and 09:30 minutes. The cost table below runs it to 2.0 points.
Why overnight and not the day session. Her sentence had two halves. The first half (a buy day is coming) tested as a positive overnight drift and a flat day session. The second half (the upside unfolded overnight, so the open is late) tested as: buying the 09:30 open after the overnight already ran 0.3 ATR or more loses money in both windows. Section 8 shows both.
| Window | n | pts/trade | $/trade | Net $ | PF | t | Win | Max DD |
|---|---|---|---|---|---|---|---|---|
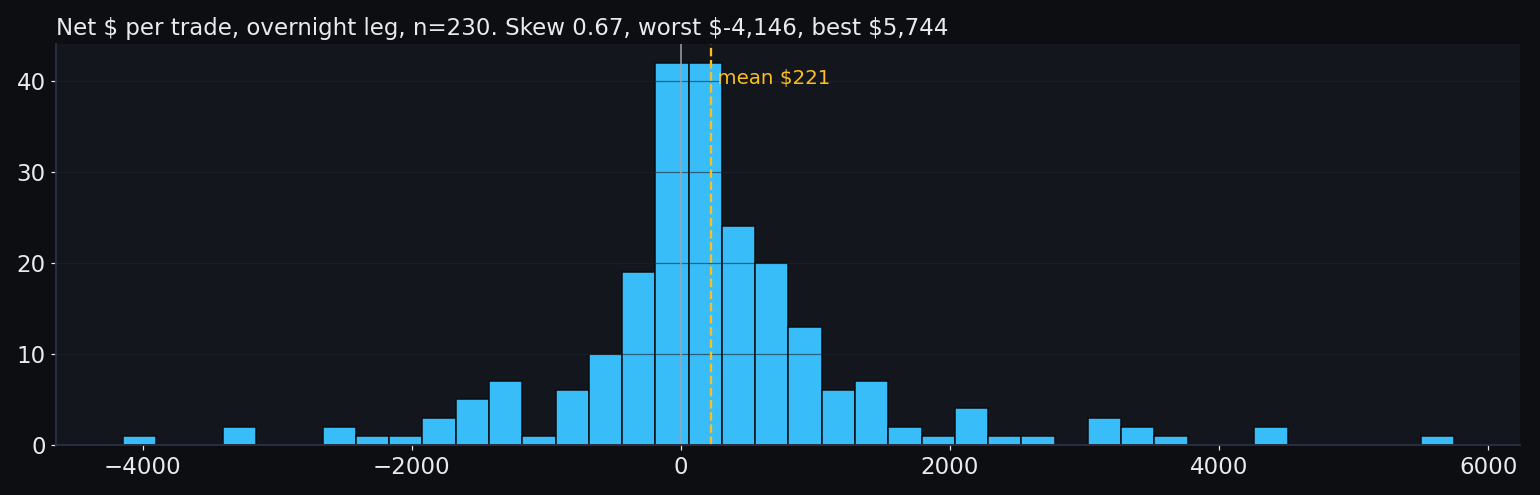
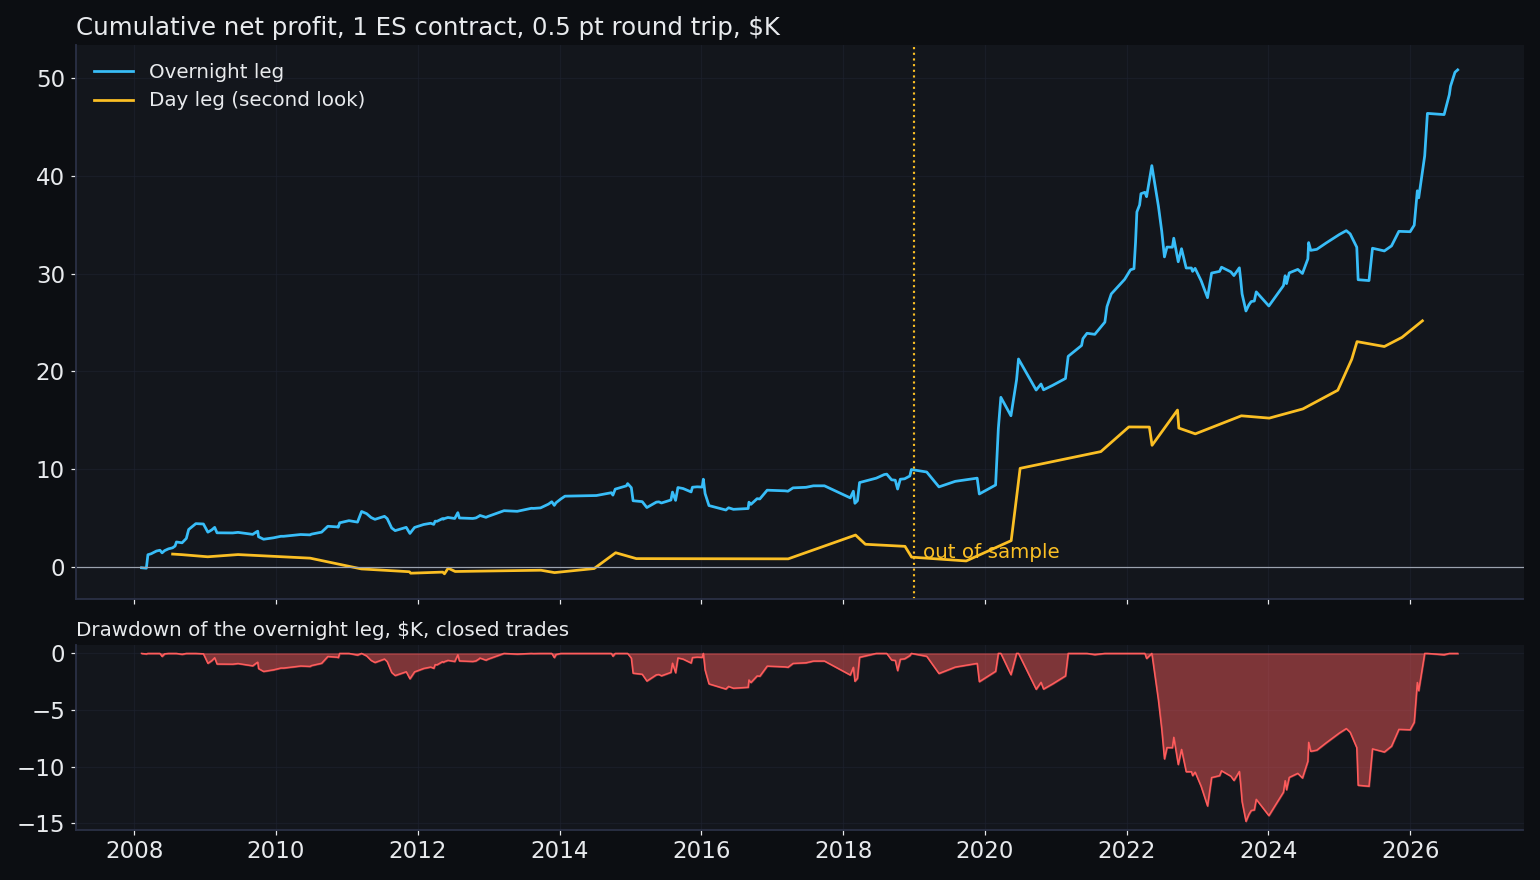
| 2008 → Sep 2026 | 230 | +4.42 | +$221 | +$50,780 | 1.83 | 2.85 | 61% | -$14,833 |
| 2008 → 2018 (in sample) | 136 | +1.47 | +$74 | +$9,998 | 1.52 | 1.70 | 59% | -$3,144 |
| 2019 → Sep 2026 (out of sample) | 94 | +8.68 | +$434 | +$40,782 | 1.98 | 2.45 | 64% | -$14,833 |
| 2020 → | 89 | +9.73 | +$486 | +$43,278 | 2.13 | 2.64 | 65% | -$14,833 |
| 2025 → | 20 | +16.80 | +$840 | +$16,802 | 3.69 | 1.96 | 60% | -$5,095 |
| 2026 YTD | 10 | +33.03 | +$1,651 | +$16,514 | 20.47 | 2.85 | 80% | -$725 |
| every session, same window · 2008 → Sep 2026 | 4795 | +0.42 | +$21 | +$100,818 | 1.07 | 1.39 | 53% | — |
| every session, same window · 2008 → 2018 (in sample) | 2815 | -0.02 | -$1 | -$3,337 | 0.99 | -0.13 | 52% | — |
| every session, same window · 2019 → Sep 2026 (out of sample) | 1980 | +1.05 | +$53 | +$104,155 | 1.11 | 1.53 | 55% | — |
| every session, same window · 2025 → | 431 | +1.96 | +$98 | +$42,141 | 1.17 | 1.15 | 55% | — |
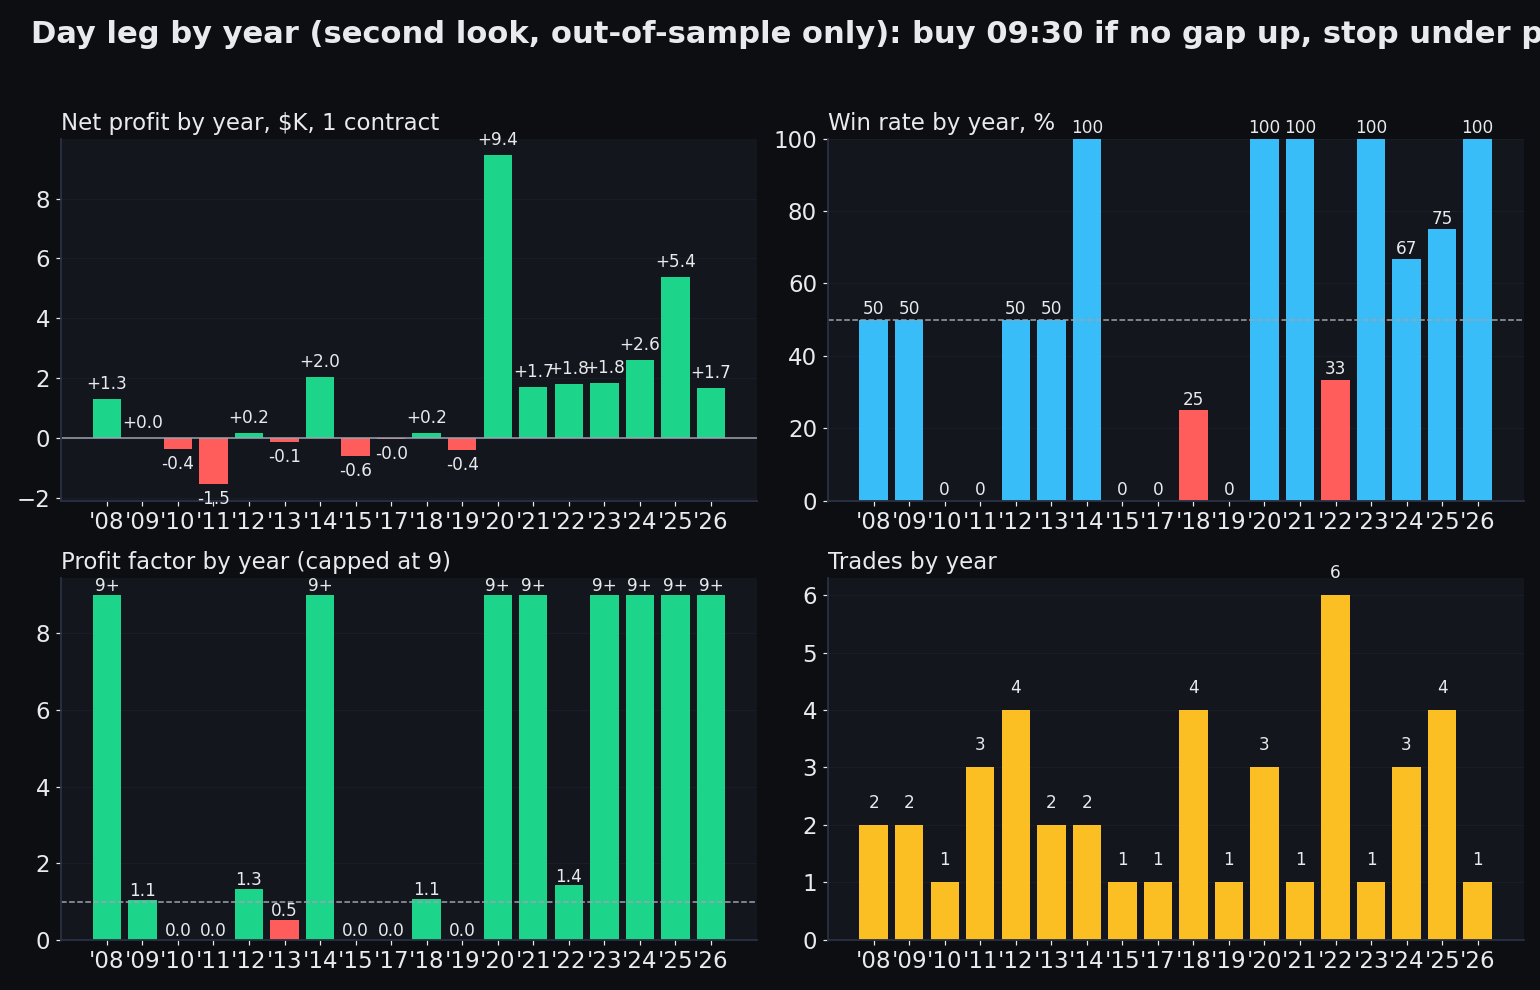
| day leg · 2008 → Sep 2026 | 42 | +11.99 | +$599 | +$25,173 | 3.24 | 2.63 | 50% | -$2,643 |
| day leg · 2008 → 2018 (in sample) | 22 | +0.96 | +$48 | +$1,058 | 1.18 | 0.27 | 36% | -$2,254 |
| day leg · 2019 → Sep 2026 (out of sample) | 20 | +24.12 | +$1,206 | +$24,116 | 5.44 | 3.03 | 65% | -$2,429 |
| day leg · 2025 → | 5 | +28.34 | +$1,417 | +$7,084 | 15.17 | 2.36 | 80% | -$500 |
| day leg · 2026 YTD | 1 | +33.75 | +$1,688 | +$1,688 | — | — | 100% | $0 |
reference/sweep_all.csv in the download.| Down day means | Streak | n IS | 2008-18 | n OOS | 2019 → | n | 2025 → | n | full |
|---|---|---|---|---|---|---|---|---|---|
| lower close, full-session bars | exactly 3 | 136 | +$74 t 1.7 | 94 | +$434 t 2.4 | 20 | +$840 t 2.0 | 230 | +$221 t 2.9 |
| lower close, full-session bars | exactly 4 | 56 | +$107 t 0.9 | 43 | +$500 t 1.9 | 6 | +$882 t 1.4 | 99 | +$278 t 2.1 |
| lower close, full-session bars | exactly 5 | 27 | +$81 t 0.5 | 14 | -$230 t -0.5 | 2 | +$979 t nan | 41 | -$25 t -0.1 |
| lower close, full-session bars | at least 2 | 546 | +$45 t 1.8 | 379 | +$96 t 1.0 | 77 | +$351 t 1.5 | 925 | +$66 t 1.6 |
| lower close, full-session bars | at least 3 | 240 | +$94 t 2.1 | 158 | +$338 t 2.4 | 28 | +$859 t 2.6 | 398 | +$191 t 3.1 |
| lower close, full-session bars | at least 4 | 104 | +$120 t 1.4 | 64 | +$198 t 0.9 | 8 | +$907 t 2.0 | 168 | +$150 t 1.5 |
| lower low, full-session bars | exactly 3 | 155 | +$62 t 1.3 | 122 | +$264 t 1.6 | 28 | +$201 t 0.4 | 277 | +$151 t 1.9 |
| lower low, full-session bars | exactly 4 | 71 | +$100 t 1.0 | 63 | +$461 t 2.0 | 18 | +$1,076 t 2.0 | 134 | +$270 t 2.3 |
| lower low, full-session bars | exactly 5 | 38 | +$134 t 1.6 | 17 | -$378 t -0.6 | 2 | +$813 t nan | 55 | -$25 t -0.1 |
| lower low, full-session bars | at least 2 | 619 | +$26 t 1.1 | 445 | +$131 t 1.5 | 92 | +$378 t 1.6 | 1064 | +$70 t 1.8 |
| lower low, full-session bars | at least 3 | 294 | +$74 t 1.9 | 225 | +$253 t 2.0 | 48 | +$555 t 1.5 | 519 | +$152 t 2.6 |
| lower low, full-session bars | at least 4 | 139 | +$88 t 1.4 | 103 | +$240 t 1.3 | 20 | +$1,050 t 2.1 | 242 | +$153 t 1.7 |
| lower close AND lower low, full | exactly 3 | 77 | +$90 t 1.0 | 55 | +$515 t 2.3 | 9 | +$507 t 0.6 | 132 | +$267 t 2.5 |
| lower close AND lower low, full | exactly 4 | 23 | +$241 t 1.2 | 18 | +$34 t 0.1 | 2 | +$719 t nan | 41 | +$150 t 0.8 |
| lower close AND lower low, full | exactly 5 | 7 | +$342 t 1.5 | 4 | +$548 t 0.5 | 0 | — | 11 | +$417 t 1.0 |
| lower close AND lower low, full | at least 2 | 309 | +$91 t 2.6 | 219 | +$203 t 1.6 | 37 | +$742 t 2.1 | 528 | +$138 t 2.5 |
| lower close AND lower low, full | at least 3 | 111 | +$134 t 1.7 | 80 | +$357 t 1.9 | 11 | +$546 t 0.8 | 191 | +$227 t 2.5 |
| lower close AND lower low, full | at least 4 | 34 | +$233 t 1.4 | 25 | +$9 t 0.0 | 2 | +$719 t nan | 59 | +$138 t 0.8 |
| lower close, RTH bars | exactly 3 | 134 | +$45 t 0.9 | 99 | +$346 t 1.7 | 24 | +$851 t 1.4 | 233 | +$173 t 1.9 |
| lower close, RTH bars | at least 3 | 243 | +$66 t 1.5 | 169 | +$352 t 2.3 | 39 | +$794 t 2.0 | 412 | +$183 t 2.7 |
| lower low, RTH bars | exactly 3 | 150 | +$10 t 0.2 | 118 | +$437 t 2.4 | 28 | +$845 t 1.5 | 268 | +$198 t 2.3 |
| lower low, RTH bars | at least 3 | 268 | +$52 t 1.2 | 204 | +$318 t 2.4 | 43 | +$749 t 1.9 | 472 | +$167 t 2.6 |
| Stop | Target | 2008-18 | 2019 → | OOS win | OOS PF | 2025 → |
|---|---|---|---|---|---|---|
| none | 0.50 ATR | +0.078 t 2.71 | +0.088 t 2.08 | 65% | 1.69 | +0.147 |
| none | 0.75 ATR | +0.070 t 2.24 | +0.106 t 2.27 | 63% | 1.81 | +0.190 |
| 1.0 ATR | 0.50 ATR | +0.063 t 2.06 | +0.087 t 2.09 | 65% | 1.68 | +0.123 |
| none | none | +0.064 t 2.06 | +0.095 t 2.07 | 63% | 1.73 | +0.196 |
| none | 1.50 ATR | +0.064 t 2.06 | +0.099 t 2.11 | 63% | 1.76 | +0.196 |
| none | 2.00 ATR | +0.064 t 2.06 | +0.095 t 2.07 | 63% | 1.73 | +0.196 |
| none | 1.00 ATR | +0.063 t 2.05 | +0.097 t 2.10 | 63% | 1.74 | +0.196 |
| 1.5 ATR | 0.50 ATR | +0.063 t 2.04 | +0.087 t 2.05 | 65% | 1.68 | +0.147 |
| 1.0 ATR | 0.75 ATR | +0.064 t 1.94 | +0.105 t 2.28 | 63% | 1.80 | +0.165 |
| 1.5 ATR | 0.75 ATR | +0.064 t 1.93 | +0.105 t 2.24 | 63% | 1.80 | +0.190 |
| 1.0 ATR | 2.00 ATR | +0.057 t 1.77 | +0.095 t 2.08 | 63% | 1.72 | +0.172 |
| 1.0 ATR | 1.50 ATR | +0.057 t 1.77 | +0.099 t 2.11 | 63% | 1.75 | +0.172 |
| 1.0 ATR | none | +0.057 t 1.77 | +0.095 t 2.08 | 63% | 1.72 | +0.172 |
| 1.5 ATR | none | +0.058 t 1.76 | +0.095 t 2.04 | 63% | 1.72 | +0.196 |
| 1.5 ATR | 2.00 ATR | +0.058 t 1.76 | +0.095 t 2.04 | 63% | 1.72 | +0.196 |
| 1.5 ATR | 1.50 ATR | +0.058 t 1.76 | +0.099 t 2.08 | 63% | 1.75 | +0.196 |
| 1.0 ATR | 1.00 ATR | +0.057 t 1.75 | +0.096 t 2.10 | 63% | 1.73 | +0.172 |
| 1.5 ATR | 1.00 ATR | +0.057 t 1.74 | +0.096 t 2.06 | 63% | 1.73 | +0.196 |
| 0.75 ATR | 0.50 ATR | +0.054 t 1.72 | +0.096 t 2.43 | 65% | 1.80 | +0.136 |
| 0.75 ATR | 0.75 ATR | +0.055 t 1.63 | +0.114 t 2.58 | 63% | 1.93 | +0.178 |
| 0.75 ATR | 1.50 ATR | +0.049 t 1.46 | +0.107 t 2.40 | 63% | 1.88 | +0.185 |
| 0.75 ATR | 2.00 ATR | +0.049 t 1.46 | +0.103 t 2.37 | 63% | 1.84 | +0.185 |
| 0.75 ATR | none | +0.049 t 1.46 | +0.103 t 2.37 | 63% | 1.84 | +0.185 |
| 0.75 ATR | 1.00 ATR | +0.048 t 1.44 | +0.105 t 2.40 | 63% | 1.85 | +0.185 |
| 0.5 ATR | 0.50 ATR | +0.035 t 1.10 | +0.085 t 2.22 | 62% | 1.69 | +0.148 |
| 0.5 ATR | 0.75 ATR | +0.035 t 1.05 | +0.090 t 2.09 | 59% | 1.68 | +0.190 |
| 0.5 ATR | 2.00 ATR | +0.029 t 0.88 | +0.080 t 1.89 | 59% | 1.61 | +0.197 |
| 0.5 ATR | 1.50 ATR | +0.029 t 0.88 | +0.084 t 1.92 | 59% | 1.64 | +0.197 |
| 0.5 ATR | none | +0.029 t 0.88 | +0.080 t 1.89 | 59% | 1.61 | +0.197 |
| 0.5 ATR | 1.00 ATR | +0.028 t 0.86 | +0.082 t 1.91 | 59% | 1.62 | +0.197 |
| Cost | 2008 → | 2008-18 | 2019 → | 2025 → | 2026 |
|---|---|---|---|---|---|
| 0 pts (gross) | +4.92 pts PF 1.96 · t 3.17 | +1.97 pts PF 1.74 · t 2.28 | +9.18 pts PF 2.06 · t 2.59 | +17.30 pts PF 3.86 · t 2.02 | +33.53 pts PF 22.01 · t 2.89 |
| 0.5 pt round trip ($25) — page assumption | +4.42 pts PF 1.83 · t 2.85 | +1.47 pts PF 1.52 · t 1.70 | +8.68 pts PF 1.98 · t 2.45 | +16.80 pts PF 3.69 · t 1.96 | +33.03 pts PF 20.47 · t 2.85 |
| 1.0 pt ($50) | +3.92 pts PF 1.71 · t 2.53 | +0.97 pts PF 1.32 · t 1.12 | +8.18 pts PF 1.91 · t 2.31 | +16.30 pts PF 3.53 · t 1.90 | +32.53 pts PF 19.11 · t 2.81 |
| 1.5 pt ($75) | +3.42 pts PF 1.60 · t 2.21 | +0.47 pts PF 1.14 · t 0.54 | +7.68 pts PF 1.83 · t 2.17 | +15.80 pts PF 3.37 · t 1.84 | +32.03 pts PF 17.89 · t 2.76 |
| 2.0 pt ($100) — punishment | +2.92 pts PF 1.49 · t 1.88 | -0.03 pts PF 0.99 · t -0.03 | +7.18 pts PF 1.76 · t 2.03 | +15.30 pts PF 3.23 · t 1.78 | +31.53 pts PF 16.80 · t 2.72 |
| Window | All | best 1 gone | best 5 gone | best 10 gone | top-5 share |
|---|---|---|---|---|---|
| 2008 → Sep 2026 | +$50,780 | +$45,036 | +$29,234 | +$13,776 | 19% |
| 2019 → Sep 2026 (out of sample) | +$40,782 | +$35,038 | +$19,237 | +$3,778 | 26% |
| 2025 → | +$16,802 | +$12,472 | -$676 | -$5,614 | 76% |
| 2026 YTD | +$16,514 | +$12,184 | +$909 | $0 | 90% |
| At 09:30 the overnight was… | n IS | 2008-18 | n OOS | 2019 → | n | full |
|---|---|---|---|---|---|---|
| overnight already ≥ +0.3 ATR (gapped up) | 22 | -$116 t -0.5 | 17 | -$201 t -0.4 | 39 | -$153 t -0.6 |
| overnight between +0.15 and +0.3 ATR | 9 | +$204 t 0.6 | 7 | +$987 t 1.8 | 16 | +$547 t 1.8 |
| overnight below +0.15 ATR (flat or down) | 33 | -$19 t -0.1 | 28 | +$1,055 t 2.9 | 61 | +$474 t 2.1 |
The gated day leg. The "flat or down overnight" version with a stop one tick under the prior low (no trade if the open is already at or below it): 42 trades, in sample +1.0 pts (t 0.27), out of sample +24.1 pts (t 3.03). Flat where the rule was picked, positive only where it was not. It might be a 2020-onward regime. It might be noise at this sample size. So it is a second look, not the strategy, and the forward test decides.
What isn't in this backtest (read before you trust it)
Deflated Sharpe fails. Per-trade Sharpe is 0.19. The best of 242 in-sample trials would show about 0.34 by luck, so the deflated Sharpe is 0.02. The in-sample / out-of-sample agreement, the plateau in section 5, and the every-session control are the reasons to take it seriously anyway; the DSR is the reason not to size it like a sure thing. Probability of backtest overfitting for the whole sweep is 0.28.
Most of the dollars are 2020 onward. +$9,998 in the eleven in-sample years, +$40,782 in the 7.7 out-of-sample years. The tendency was there before 2020 (t 1.70); the size of it was not. Overnight ranges got bigger.
No stop. Worst night -82.9 pts (-$4,146) on 2022-06-13. A stop was tested (section 6) and does not help; it also does not protect you from a gap that skips it.
Continuous contract. Ratio-adjusted continuous series, so early-year point values are approximate (5-8% in 2008-2015, under 1.5% since 2025). The forward seam from July 2026 is stitched from Massive/Polygon per-contract bars.
Selection. The rule was found by a 616-cell sweep on 2008-2018 and then run on 2019-2026 once. I did not re-tune after seeing the out-of-sample. I did look at the out-of-sample numbers of other cells while writing this page, which is why they are on it and not in a drawer.
No forward evidence yet. Rules frozen 2026-09-11. Not live. About 12 nights a year, so forward evidence takes years, not months; a paper sleeve is the honest next step.