Saty Phase Oscillator compression on the hourly chart draws a box (the range of the first
five compression candles, extended-hours bars). Across 8 mega-caps × 24 months × 2,449 boxes
priced with actual option trade prints: when the break happens during market hours, buying the
weekly ATM option in the break direction immediately — take-profit +100%, stop −50% — returned
+8.3% of premium per trade (t = 3.78, n = 972). Overnight gap-breaks returned nothing:
skip them.
tickers positive — NVDA +14.6%, TSLA +18.3%; AAPL the exception
≈ 0%
overnight / gap breaks (n=1,259) — the no-trade class
How to read the numbers
+8.3% per trade means: on average, each trade returned 8.3% of the premium paid.
Risk $1,000 on the option, walk away with $1,083 on average — some trades hit +100%, some stop out
at −50%, this is the blend. It is a return on premium, not on your account.
n = 972 is how many boxes that average rests on. More boxes = the average is
less likely to be a fluke of a few lucky trades.
t = 3.78 answers "could this average be luck?" It measures how far the average
sits from zero, in units of its own noise. t near 1: could easily be luck — a rerun of history might
flip the sign. t near 2: unlikely to be luck (~5% odds from a zero-edge process). t of 3.8: about
1-in-10,000 odds of appearing by chance. Rule of thumb — the average tells you how big the edge is,
t tells you how much to believe it exists, n tells you how much history that belief rests on.
The same yardstick works in reverse: the "don'ts" below have negative averages with
big t values — those are reliably losing trades, not bad luck.
The setup
Box: first 5 hourly compression candles (fewer if expansion comes early) on extended-hours bars — box top/bottom = that range. ETH bars matter: a level that held overnight is a proven level.
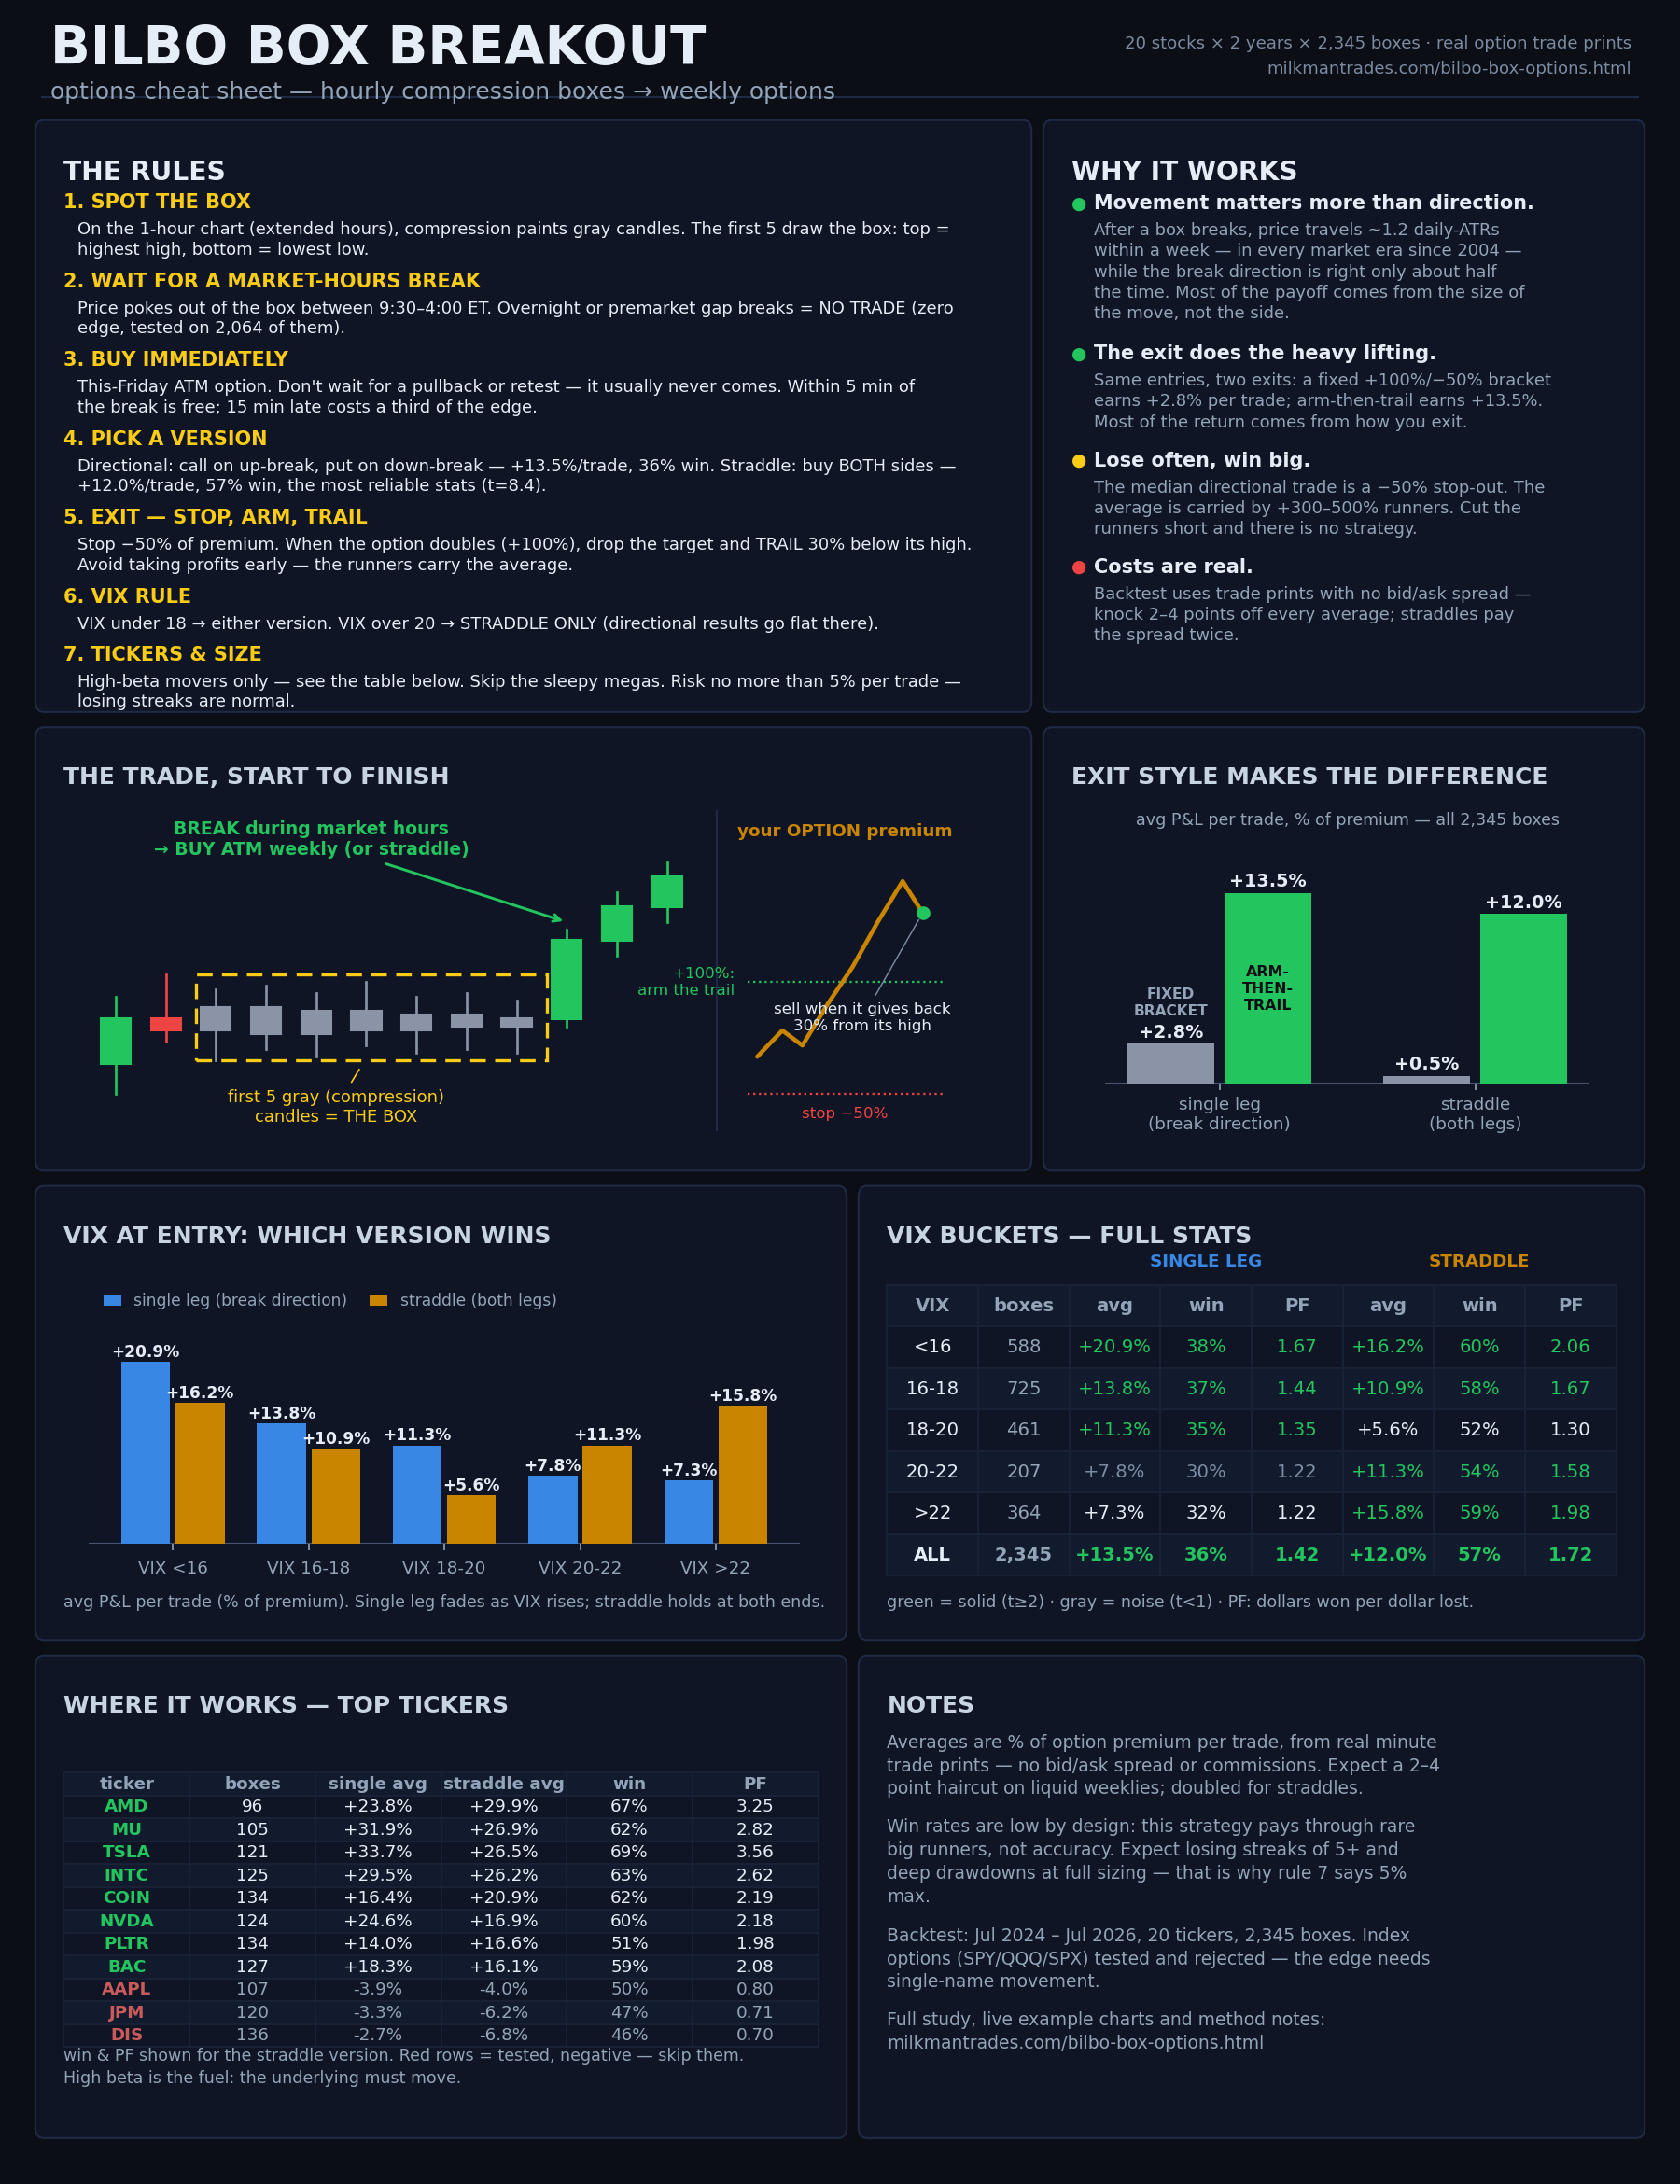
Entry: the moment price breaks either edge during regular hours — buy the weekly (nearest-Friday) ATM call on an up-break / put on a down-break. No waiting for retest: it faded at scale.
Exit (simple): bracket order — sell at +100% of premium, stop at −50%. Scale-outs at +50/+80% erase the edge; the payoff needs the doubles.
Exit (the one that matters — arm-then-trail): same −50% stop, but once the premium doubles, remove the target and trail instead: never give back more than 30% from the option's high-water mark. +14.7% per trade (t=4.84) vs +8.3% for the fixed bracket on the original 8 names. Then the real test: on 12 fresh tickers the strategy had never seen (PLTR, COIN, HOOD, INTC, MU, BAC, and more — 1,493 boxes), the fixed bracket collapsed to −0.7% while arm-then-trail held at +11.2% (t=3.95), positive on 9 of 12 names. The trail, not the entry, is where most of the return comes from. The +300–500% runners in the charts below are what pay for the ~62% of losers. Honesty note: trailing exits fire during fast moves, so fills matter — under worst-case fills it's +8.1% vs the bracket's +4.8%; the advantage holds under every fill assumption, the absolute level depends on execution.
Why it works (20-year check): across 10,764 box breaks since 2004, the direction of the break has almost no predictive power in any era (win rate ~50%) — but the excursion after a break is big in every era: the median move-in-your-favor within the week is ~1.2 daily-ATRs, in both directions, in every regime. The trade isn't a direction bet; it's buying cheap convexity right before price travels, and letting the trail harvest whichever way it goes.
The direction-free version (strongest stats in the study): since direction barely matters, buy BOTH legs — an ATM weekly straddle at the break, each leg with its own −50% stop and arm-then-trail. Across all 20 tickers and 2,345 boxes: +12.0% of combined premium per trade, t = 8.42, 57% win rate — and identical in and out of sample (+13.5% original 8, +11.0% on the 12 fresh names). You give up ~1.5 points of average versus picking the break direction, and in exchange get a far smoother ride (win rate 57% vs 36%) and one less decision to make. Skip the sleepy names (AAPL, DIS, JPM negative); the high-beta names carry it (AMD +30%, MU +27%, TSLA +26%, INTC +26%, COIN +21%). Two legs also means double the spread cost — the real-world haircut is bigger here.
VIX filter: below VIX 18 either version works (directional has the higher average); above VIX 20 the directional trade decays to noise — straddle only. Full regime table below.
Skip: breaks that happen overnight/premarket (gap opens outside the box) — flat to negative as a class.
4-bar box formed on the afternoon of Apr 8-9. Price broke the box top at 3:55pm ET; immediate entry, Apr-17 185C @ 2.77. TP +100% hit the next session. Holding to expiry would have returned +502% — winners out of these boxes run.
Down-break winner — GOOGL, Feb 18 2025
Box broke down mid-session; Feb-28 182.5P @ 2.61 at the break. TP +100% hit within two sessions. Hold-to-expiry: +368%. Down-breaks work as well as up-breaks (+9.5% vs +7.2% avg) — buy the direction of the break, either way.
Stop-out — NVDA, Nov 24 2025
The honest one: down-break, Nov-28 177.5P @ 3.75, no follow-through — premium bled to the −50% stop. Held to expiry this lost −86%. The bracket's job is exactly this: half the premium walks away.
Per-ticker (intraday breaks, TP100/stop50)
Ticker
avg P&L/trade
t
win rate
profit factor
gain-to-pain
boxes
TSLA
+18.3%
2.90
44%
1.56
2.14
127
NVDA
+14.6%
2.37
43%
1.50
2.95
130
MSFT
+11.0%
1.71
38%
1.21
0.52
115
AMD
+9.1%
1.37
39%
1.26
1.08
104
AMZN
+8.6%
1.46
37%
1.14
0.40
139
META
+6.4%
0.99
38%
1.21
0.49
115
GOOGL
+4.9%
0.87
35%
1.06
0.16
131
AAPL
−8.5%
−1.39
28%
0.78
−0.42
111
All 8
+8.3%
3.78
38%
1.20
2.49
972
Win rate — the share of trades that made any money. 38% sounds low, and that's the
point: this is a payoff-driven strategy, not an accuracy-driven one. Winners pay +100% of premium,
losers cost −50%, so 4 wins can carry 6 losses. Expect losing streaks — at 38%, five losers in a row
happens routinely — and size so the streaks don't shake you out.
Profit factor — every dollar won divided by every dollar lost, per trade.
1.00 is breakeven; 1.20 means the wins collected $1.20 for every $1.00 the losses gave back.
Below 1.00 (AAPL's 0.78) means the losses outweigh the wins outright.
Gain-to-pain — the same idea measured on monthly P&L instead of per trade:
total net profit divided by the sum of losing months. It punishes strategies that make their money in
lumps and give it back in drawdowns. Above 1.0 is good, above 2.0 is strong. Note the "All 8" row:
trading every name together scores 2.49 — better than most single names — because a bad month in one
ticker tends to be covered by the others. The edge diversifies.
VIX regime: when to trade which version
Tag every box with the VIX level at the moment of entry and the two versions split cleanly:
the directional trade is a calm-market trade — its edge fades as VIX rises and is statistical noise
above 20. The straddle holds up everywhere, and above VIX 22 it beats the directional version outright
(+15.8% vs +7.3% per trade). Straddles cost more when VIX is high (4.4% → 5.5% of spot), but the movement
that follows a box break grows faster than the price of admission.
single leg, break direction (arm-then-trail)
straddle, both legs (arm-then-trail)
Average premium P&L per trade by VIX at entry — same 2,345 boxes and exits as the sections above.
VIX at entry
boxes
single leg (break direction)
straddle (both legs)
avg P&L
t
win
PF
avg P&L
t
win
PF
VIX <16
588
+20.9%
4.3
38%
1.67
+16.2%
5.8
60%
2.06
VIX 16-18
725
+13.8%
3.6
37%
1.44
+10.9%
4.5
58%
1.67
VIX 18-20
461
+11.3%
2.0
35%
1.35
+5.6%
1.8
52%
1.30
VIX 20-22
207
+7.8%
0.9
30%
1.22
+11.3%
2.2
54%
1.58
VIX >22
364
+7.3%
1.3
32%
1.22
+15.8%
4.0
59%
1.98
All
2345
+13.5%
5.8
36%
1.42
+12.0%
8.4
57%
1.72
Read the win rates first: the single leg wins 30–38% of the time in every regime — its edge
lives in how big the winners are (average winner ≈ +130% of premium vs average loser −50%). The straddle wins
52–60% of the time with smaller winners (≈ +51%) against smaller losers (≈ −39%): one side usually pays for
most of the other.
The pattern, not the wiggles: single-leg profit fades monotonically as VIX rises
(+20.9% → +7.3%, and its t drops below 2 past VIX 18 — no longer distinguishable from luck). The straddle is
strong at both ends (+16.2% below 16, +15.8% above 22 — each confirmed in both years of data separately);
its 18–20 dip is a year-1 artifact (+0.5% then, +11.1% in year 2), so treat the middle as "average", not "dead".
The rule that falls out: VIX under ~18 — take either (single leg pays more if you can sit
through a 37% win rate). VIX over 20 — straddle only. High VIX means the market whips both ways;
picking a direction hasn't paid there, while owning both sides has.
Caveat: high-VIX entries cluster in calendar time (Aug 2024, Apr 2025). Date-clustered t-stats
confirm the extremes (straddle above 22: t=3.6) but the 20–22 sliver (n=207) is thin — the buckets at the
ends are the trustworthy ones.
The don'ts (each tested, each lost)
Don't trade the gap. Overnight breaks bought at the open ≈ 0% across 1,259 boxes.
Don't scale out early. TP1 +50% / TP2 +80% turns +8.3% into −1%. The edge lives in the tail.
Don't fade strength in the box. Shorting the top third: −6.2%/trade, t=−3.87, n=1,421 — the most reliable losing trade in the study.
Don't overthink the oscillator. PO slope, position, and direction added nothing on top of the box: with-slope and against-slope entries performed the same. The compression flag is the signal; the box does the rest.
Don't take it to index options. SPY, QQQ and SPX (via SPXW) tested on 967 index boxes: the directional version is negative, the straddle is statistically unconfirmed, and 55% of index breaks happen overnight (the no-trade class). Index vol carries the variance risk premium — the movement this trade harvests is only underpriced on single names.
Method & honesty notes. Events: Saty Pine-spec po_compression on hourly bars (ETH 04:00–19:55 ET),
8 tickers (AMZN NVDA MSFT AAPL META GOOGL TSLA AMD), Jul 2024 – Jul 2026. Options: Massive/Polygon minute
trade prints, 21k contracts; fills = last print at signal (median lag ≈1 min); expiries anchored to entry date.
No bid/ask or commissions modeled — expect a 2–4pp haircut on liquid ATM weeklies; thin strikes worse.
Stats are episode-clustered; TP fills assume a resting limit at target; stops assume no gap-through.
Every result was judged against a random-entry baseline, and candidate edges that failed validation
on held-out tickers (retest entries, box-maturity filters, index options) are reported dead rather than
silently dropped. Charts show Saty-style hourly candles
(gray = compression), 8/21 + 13/48 EMA ribbons, phase oscillator (magenta = compression).
Built 2026-07-08 · data through 2026-07-06 ·
one-page cheat sheet (PNG)